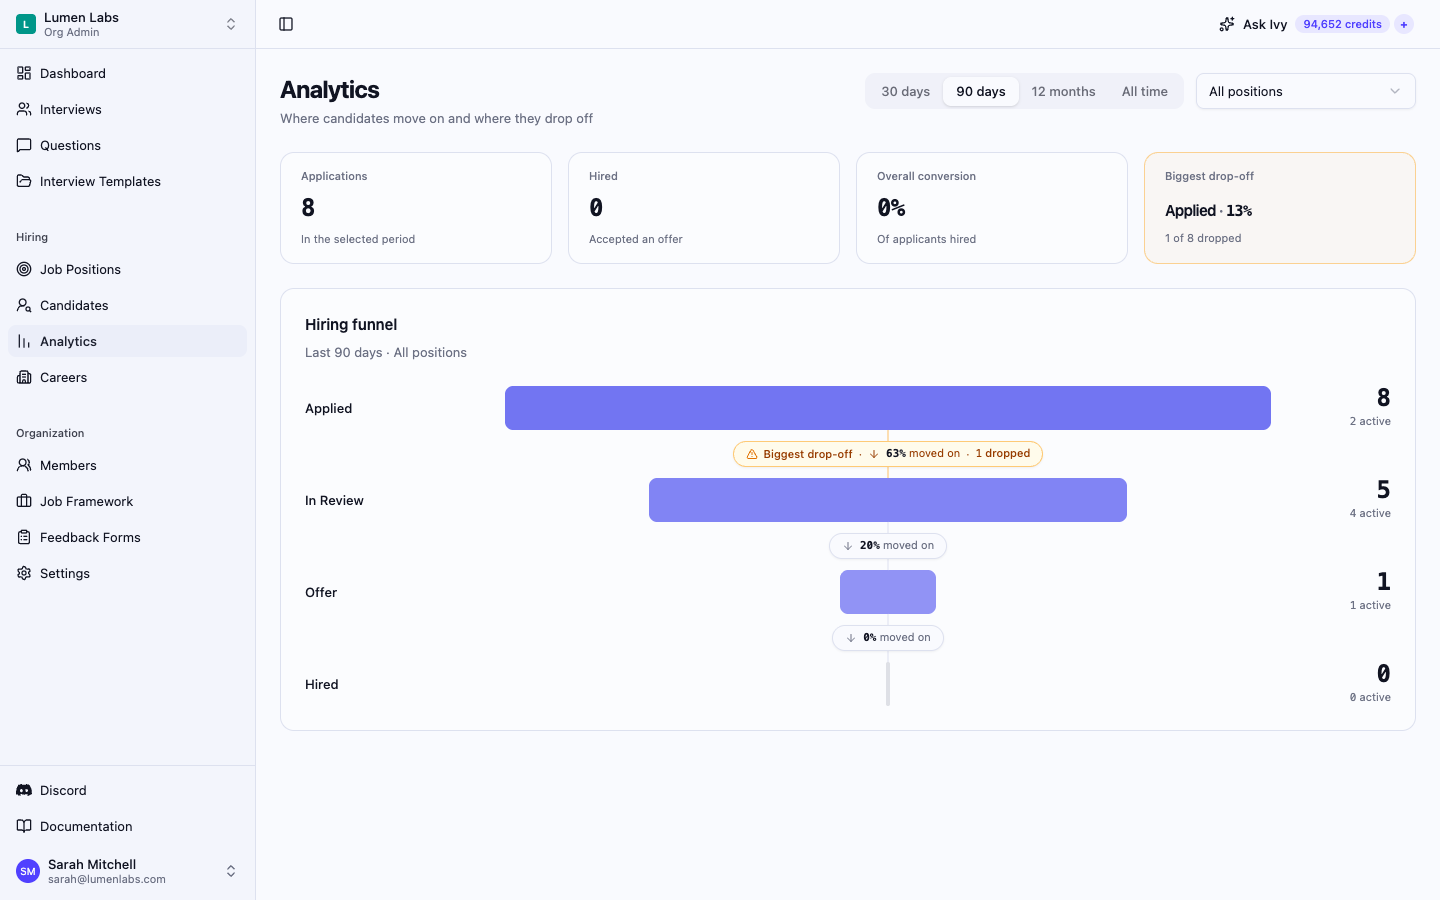
The Analytics page includes your hiring funnel, a separate Time to hire report, Offer metrics when your plan or an active feature grace period includes offers and your role can create offers, and, when your role can read all interviews, Interviewer calibration and Interview activity. The funnel shows how many applications reached each stage, how many are still in progress, how many dropped out, and what share moved on to the next stage. It points out the stage with the biggest drop-off and lets you open the list of candidates who dropped at any stage where someone dropped.
Prerequisites
Opening Analytics
Select Analytics in the Hiring group of the sidebar, between Candidates and Careers. The item appears only when you hold both permissions above. You can also select View analytics on the dashboard's Hiring funnel widget — see Dashboard.
Choosing what to measure
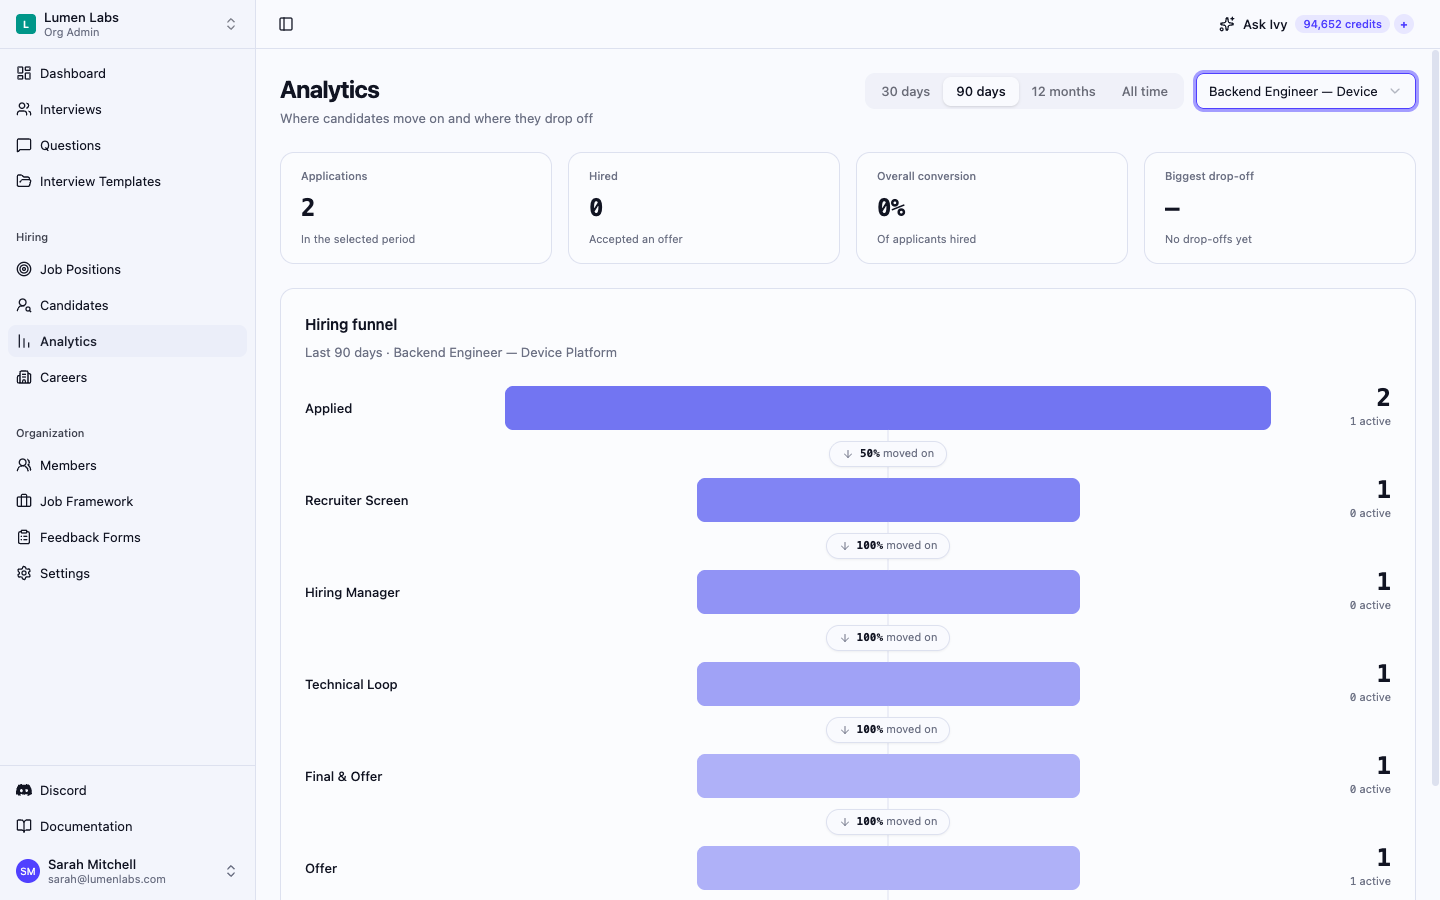
Two filters sit at the top right of the page. The period tabs control the funnel; the position menu controls every report you can see:
- Period — 30 days, 90 days, 12 months, or All time. The funnel includes applications submitted within the chosen period. 90 days is selected when you open the page.
- Position — All positions or any single job position.
Once the view has applications, the line under the Hiring funnel heading repeats your choice — for example Last 90 days · All positions. The page address keeps the period, the position, and any open drop-off list, so you can bookmark or share the exact view.
Summary tiles
When the selected view has applications, four tiles sum it up:
| Tile | What it shows |
|---|---|
| Applications | Applications submitted in the selected period |
| Hired | Applications that reached Hired |
| Overall conversion | Hired applications as a share of all applications |
| Biggest drop-off | The stage with the highest drop-off rate and how many of the applications that reached it dropped there |
Reading the funnel
The org-wide funnel has four stages: Applied, In Review, Offer, and Hired. Each application counts once at a stage determined by its current status and retained offer, interview, phase, and status-history evidence:
- Hired — the application is hired.
- Offer — the application is in Offer, or an offer was created for it.
- In Review — any of these is true: the application is in In Review, it is in one of the position's pipeline phases, it has an interview that was not cancelled, or its status was ever changed to or from In Review, Offer, or Hired.
- Applied — none of the above.
Because the status history counts, an application that went back to Applied after its only interview was cancelled still counts as having reached In Review.
Each stage row shows three numbers:
- The large number is how many applications reached the stage — those that counted at this stage or any later one.
- active is how many of the applications counted at this stage are still in progress — not hired, rejected, or withdrawn.
- dropped, on the connector below the stage, is how many applications counted at this stage were rejected or withdrew. It appears only when at least one application dropped there.
The connector between two stages shows the share that moved on: the applications that reached the next stage as a percentage of those that reached this one. It shows — when no application reached the earlier stage.
Biggest drop-off
The biggest drop-off is the stage with the highest share of dropped applications — dropped divided by reached — counting only stages where at least one application dropped. Its connector is highlighted and labelled Biggest drop-off, and the Biggest drop-off tile names the stage with its rate, for example Applied · 13% above 1 of 8 dropped. When nothing has dropped yet, the tile shows No drop-offs yet.
Funnel for a single position
When you pick a position, the funnel replaces In Review with that position's own pipeline phases, in pipeline order: Applied, then each phase, then Offer and Hired. An application counts at the furthest phase it reached — the latest in pipeline order among its current phase and the phases of its interviews that were not cancelled — and also counts as having reached every earlier phase. An application without Hired or Offer evidence and with no reached phase counts at Applied in this view, even if it counts as In Review in the org-wide funnel.
Seeing who dropped at a stage
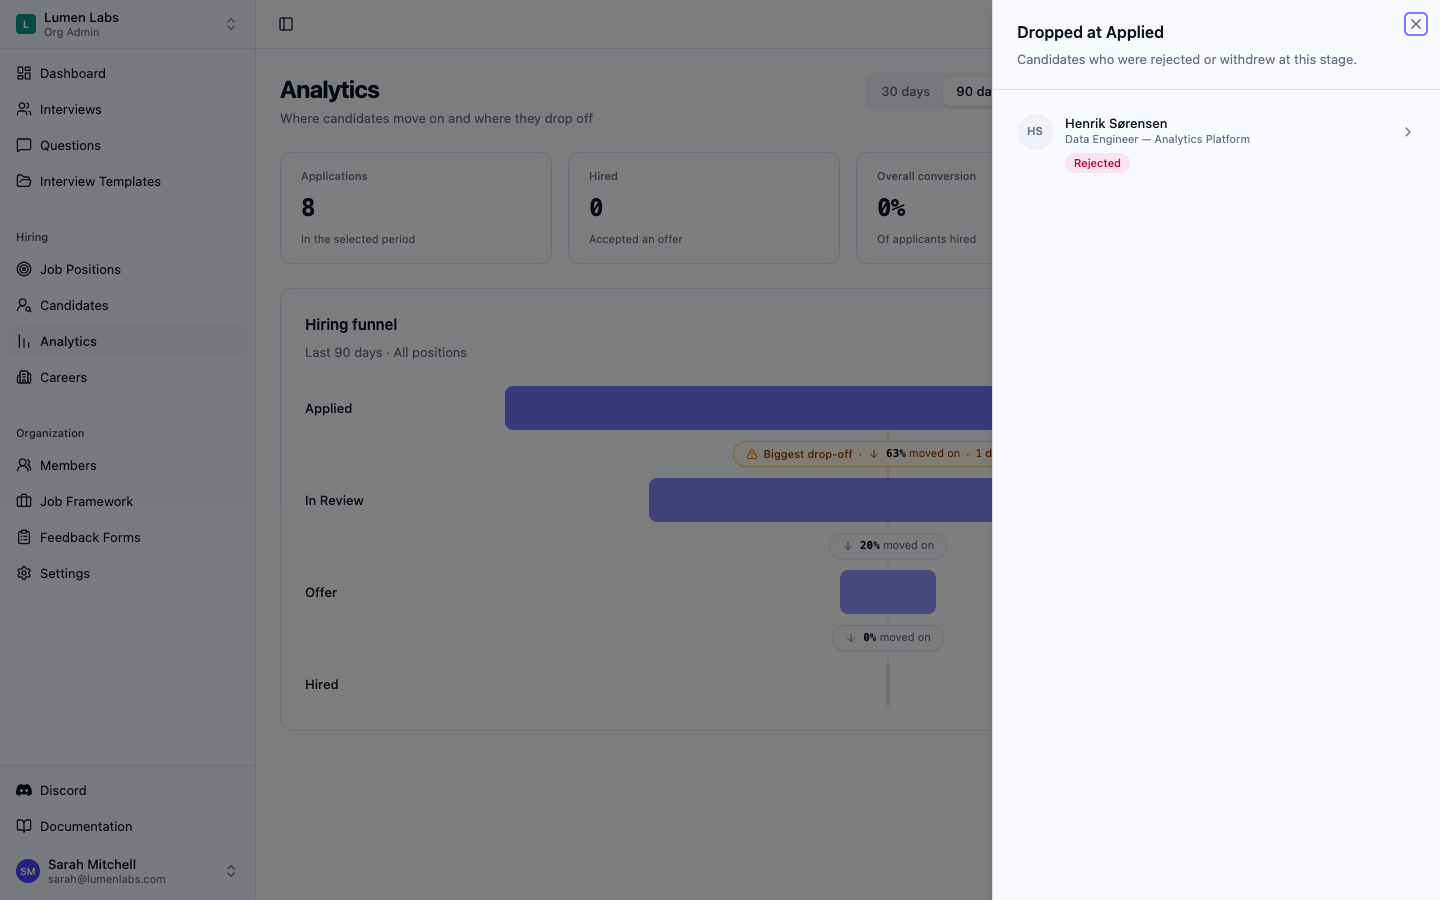
Select the dropped count on a stage's connector to open Dropped at [stage name], a panel listing the applications submitted in the selected period that were rejected or withdrew at that stage. Each row shows the candidate's name, the position, a Rejected or Withdrawn badge, the rejection reason when one was recorded, and, when the date is known, how long ago they dropped — for example Just now, 5h ago, Yesterday, or 3d ago. The panel lists up to 200 applications, and the most recent drops are listed first.
Select a row to open that application. When none of the applications submitted in the selected period dropped at the stage, the panel shows No one dropped here.
Time to hire
Below the funnel, Time to hire shows the mean elapsed UTC days from application to the first recorded Hired status for applications that are currently hired. Fractional days are included. This measures the application-to-hired interval, rather than time since a position was opened.
Choose 30 days, 90 days, or 365 days on the tabs in the Time to hire card. The default is 90 days. These dates select when applications were submitted, regardless of when they were hired. An older application hired recently is outside a shorter application cohort. This control is independent of the funnel's Period, including All time. The shared Position filter scopes both sections, and the page address preserves both periods and the position.
The summary and the By position and By job role tables show:
- Mean time — the arithmetic mean across hires with usable timing. Organization and role totals weight every known-duration application equally, rather than averaging position means.
- Known-duration hires — hired applications included in the mean.
- Excluded hires — hired applications whose first recorded hire time is missing, invalid, or earlier than their application time. Duplicate hire records use the earliest parseable hire time; a later record does not replace an earlier negative interval.
With no known-duration hires, the mean is Unavailable, rather than zero. The counts still show any excluded hires. A real same-instant hire can show 0 days; very small positive values show <0.001 days. With no hires at all, the detailed report says No hires in this application cohort. Loading and failed requests have separate states; use Try again if the report says Couldn't load time to hire.
The dashboard and an existing position's Overview include compact Time to hire widgets for the last 90 days of applications. Select View report to open this report with the widget's period and position scope. Both widgets require candidates:view and job_positions:view; opening the position editor also requires permission to update positions.
Industry benchmarks use different start and end clocks. Compare a figure only when its definition matches this application-to-hired interval. The report links the time-to-hire benchmark guide for this context.
Offer metrics
Below Time to hire, Offer metrics shows how the offers sent for the selected applications were answered, and how long it took to send the first offer after each application. It needs offers:create in addition to the two Analytics permissions, and a plan that includes offers (Growth or Scale) or an active feature grace period. Without them, the section is hidden and its data is not requested; the other reports remain available.
Choose 30 days, 90 days, or 365 days on the tabs at the top of the Offer metrics card; its subtitle shows the active cohort, for example Application cohort · Last 90 days. The default is 90 days. These dates select when applications were submitted, regardless of when their offers were sent or answered. This control is independent of the funnel's Period and of the Time to hire application cohort. The shared Position filter scopes it, and the page address preserves the cohort and the position.
The acceptance side shows:
- Accepted and Declined — offers whose saved status is accepted or declined, with Resolved as their total. The large percentage is accepted offers divided by resolved offers.
- Sent, awaiting response — sent offers with no answer saved yet.
- Expired — offers whose saved status is expired.
Awaiting-response and expired offers are counted separately and stay out of the percentage. Drafts, offers waiting for approval, and approved offers that have not been sent are not counted anywhere in this section. When no offer has been accepted or declined, the percentage shows Unavailable, not 0%.
These figures use the status saved on each offer. Intervy does not check response deadlines when you open the report, so an offer past its deadline stays in Sent, awaiting response until its saved status changes to expired.
The timing side shows the mean elapsed UTC days from each application to the first recorded send of its offer, with fractional days. Sent means the send was recorded in Intervy, not that the email was delivered. Offers that were sent and later accepted, declined or expired all count. It also shows:
- Known-duration applications — applications included in the mean.
- Excluded applications — applications with a sent offer whose send time is missing, invalid, or earlier than the application time.
With no known-duration applications, the mean shows Unavailable, rather than zero, and the counts still show any excluded applications. A same-instant send can show 0 days; very small positive values show <0.001 days. This measures application to first offer sent, not time to hire, so it does not change the Time to hire report.
Loading and failed requests have separate states. If the section says Couldn’t load offer metrics, select Retry offer metrics.
Interviewer calibration
Below Offer metrics (or Time to hire when Offer metrics is hidden), Interviewer calibration shows rating distributions by interviewer, feedback form version and rating field. It requires interviews:view_all in addition to the two Analytics permissions. Without that extra permission, the section is hidden and its data is not requested; the hiring funnel and Time to hire remain available.
Choose 30 days, 90 days, 365 days, or All time on the tabs at the top of the Interviewer calibration card. The default is 90 days. This period uses feedback submission time in UTC, independently of the funnel's period and the time-to-hire application cohort. Position scopes every report you can see. Standalone interviews without an application contribute only to All positions. The page address preserves the submission period and position.
Only submitted feedback on completed interviews contributes. The saved feedback interviewer keeps the attribution when another authorized member edits or completes the feedback. Different forms, versions and fields stay separate. Values are interpreted using the current field definitions of the referenced form version, so this is not a snapshot of earlier definitions.
Each group shows the interviewer, form version, field and scale, every rating bucket's count, and Valid ratings, Excluded invalid, and Missing counts. Small scales show each bucket separately, including zeros. Large empty ranges show 0 each for every rating in that range; configured labels remain visible. Only whole-number ratings within the field's scale contribute to the valid sample. Missing or blank values count as missing; invalid, out-of-range, non-integer and duplicate responses are excluded. Text, selections and question-answer ratings do not contribute. Draft feedback and incomplete, cancelled or skipped interviews are excluded.
Below 10 valid ratings, a group shows Insufficient sample. With at least 10, All maximum ratings means every valid rating equals the highest bucket; All minimum ratings means every valid rating equals the lowest. Mixed samples receive neither flag. On a one-point scale, both descriptions can apply. These flags describe this sample; they do not establish bias, interviewer performance or comparable candidate populations.
Loading, no eligible feedback, and failed reads have separate states. If the section says Couldn’t load interviewer calibration, select Retry calibration. An empty cohort suggests trying a longer period or another position.
Interview activity
Below Interviewer calibration, Interview activity shows how many interviews were scheduled and completed in each week or month, and how that work is spread across current assignees. It requires interviews:view_all in addition to the two Analytics permissions. Without that extra permission, the section is hidden and its data is not requested; the hiring funnel and Time to hire remain available.
Use the two sets of tabs at the top of the card to choose 30 days, 90 days or 365 days, and Weekly or Monthly. The defaults are 90 days and Weekly. Weeks start on Monday and months are calendar months, both in UTC. Position scopes the report, and standalone interviews without an application count only in All positions. The page address keeps the lookback, the grouping and the position.
The first table lists each period with its Scheduled and Completed counts and a Total row. Counts cover the lookback up to the current moment, so the first and the last period can be partial; the table says which dates they cover, and interviews saved for a later time are not counted yet.
Scheduled counts each interview that is not cancelled or skipped, at the time currently saved for it. Completed counts completed interviews at their completion time. One interview can appear in both columns, in different periods. The report reads current records, so rescheduling an interview moves its count to the new date; it is not a history of bookings or reschedules.
The second table lists the current assignee of each counted interview with the same two counts, plus Unassigned. Its Total row equals the first table's. The counts describe activity only; they do not rank interviewers or use ratings.
Interviews with no usable scheduled time are left out of the Scheduled counts, and completed interviews with no usable completion time are left out of the Completed counts. A completed interview with a usable completion time still counts as Completed when its scheduled time is missing. The section lists how many were left out; these counts cover all dates.
Loading, no interviews, and failed reads have separate states. If the section says Couldn’t load interview activity, select Retry interview activity. An empty result suggests trying a longer lookback or another position.
Permissions reference
| Action | Permission | Default roles |
|---|---|---|
| View analytics (requires both permissions) | candidates:view | AdminStaffing |
| View analytics (requires both permissions) | job_positions:view | AdminStaffing |
| View offer metrics (also requires both Analytics permissions and a plan or active feature grace period that includes offers) | offers:create | AdminStaffing |
| View interviewer calibration and interview activity (also requires both Analytics permissions) | interviews:view_all | AdminStaffing |
Troubleshooting
The page shows "No applications in this period." — No application in the selected view was submitted within the chosen period. Pick a longer period, such as All time, or another position.
The page shows "Couldn't load analytics." — The funnel could not be loaded. Select Try again.
The drop-off panel shows "Couldn't load candidates." — The list could not be loaded. Select Try again in the panel.
Offer metrics is missing from the page. — The section needs offers:create in addition to both Analytics permissions, and a plan that includes offers (Growth or Scale) or an active feature grace period. Ask an organization admin to update your role or plan.
Analytics is missing from the sidebar. — You need both candidates:view and job_positions:view. Ask an organization admin to update your role.